Bitcoin market depth
This is the second in our series of visual posts on how to read the Exchange Dashboard:
- Order Book and Depth Chart (this article)
Part 1 looked at the Trade History and Price Chart, which provide information on trades that have already taken place. This article will focus on the Order Book and Depth Chart, which provide information about orders that have not yet been filled.
Just as the Price Chart was a visual representation of the Trade History in Part 1, the Depth Chart is a visual representation of the Order Book.
Depth Chart
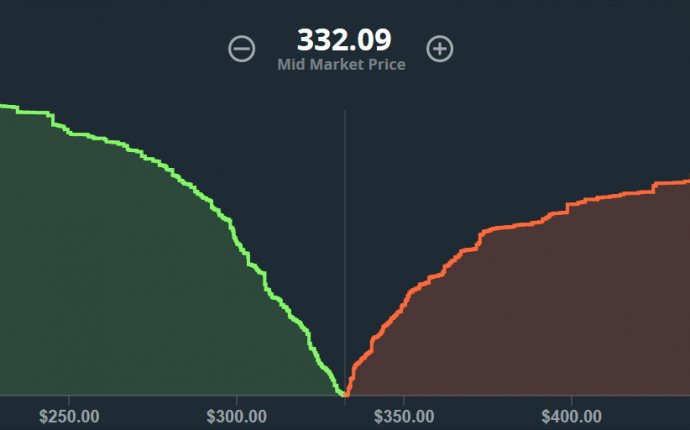
The horizontal axis of the depth chart represents the price in USD, the vertical axis represents the size of the orders on the order book in BTC.
The vertical line in the middle of the chart represents the mid market price, in this case 332.11. If you look at the order book below, you'll notice that this is the average of the lowest sell order and the highest buy order.
Looking to the right of the chart, you'll see the orders on the sell side of the Order Book, shown in red. The chart is cumulative, so the height of the line at a given sell price represents the value in BTC of all sell orders at that price or a lower price. For example, you can see that there are about 600 BTC worth of sell orders available at a price of $338.00 or less.
The buy side of the chart, shown to the left of the mid market price in green, works the same way. Hovering over a spot on the chart shows the number of BTC that can be bought or sold for a given price.
Here there are 75.6817 BTC worth of buy orders which are offer at least \$330.52. This tells us that at this point in time, given the varying sizes and prices of each order, one could create a market order to sell 75.6817 BTC, for a total price of $25, 062.40 (not including fees).
The and buttons to either side of the mid market price on top can be used to zoom in and out, enabling you to look at a wider or thinner range of prices.
The Depth Chart is a visualization of data from the Order Book
The middle row of the Order Book gives the spread between the highest buy and lowest sell orders. Sell orders are listed above in red, buy orders below in green.
A couple things to notice about the Order Book:
- The market value for a given order price is represented by the grey number in the left hand column as well as the relative size of the green or red bar on the far left.
- If multiple orders are entered at the same price, the size show will be the sum of their sizes.
- The sizes of any open orders you have are listed in the right hand column at the appropriate prices.
If you look carefully, you can see how Order Book data is reflected by the Depth Chart. For example, where you see a price that has a very large size on the Order Book, you will see a vertical wall of a corresponding height on the Depth chart.


