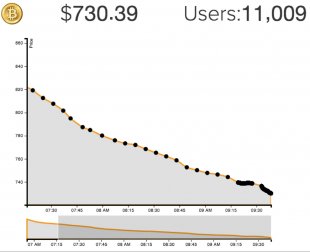
Bitcoin realtime charts
In this D3js tutorial, we’re going to dive a bit deeper with the power of D3js, showing how graphs on web pages can be interactive and display an array of time plot data using a standard Cartesian coordinate system in an easily understandable fashion.
Unfortunately, once a user has loaded a web graph, the data is already stale and the user would normally need to refresh the entire page to get the latest information. However, not having the most current, updated information can be extremely detrimental to a decision making process. Thus, the need for realtime charting!
This D3js tutorial blog post will show how you can fix this problem and use the PubNub Data Stream Network to enhance D3js with realtime graphing without reloading the page or polling with AJAX requests for changes.
PubNub Bitcoin Connection Live JSON Feed
First you’ll have to connect to a live stream of data being published to a PubNub channel. This starts by opening up a connection to the PubNub network. Here we are making a connection to the PubNub Bitcoin Exchange GitHub JavaScript Streaming SDK to get Real-Time Bitcoin price updates. If you are looking for a simplified JavaScript SDK for a Bitcoin Exchange socket data stream, you can use this: PubNub Bitcoin Exchange JavaScript SDK.
Next we are able to subscribe to the incoming feed updates on the channel and get ticker updates on the current Bitcoin price:
This will give us a large JSON payload, but we can select the two values we are interested in which is the average value and the timestamp of recorded symbol change:
Historical JSON Bitcoin Data Feed
Loading historical JSON dumps works quite well if we want to know the value of Bitcoin when it was originally recorded. Unfortunately, this does not give us much context about the data unless we leave our page open for a long time. A typical stock dashboard will also include data from the previous 24 or 48 hours.
To accomplish this, we can use the PubNub Storage and Playback service to get data previously published in the channel. When we pull the history, however, we get a long stream of tens of thousands of events in the past 24 hours. This can take long to parse through and cause long wait times before the user sees any data at all. Instead, what we want is shown below; where we take one piece of data from every time increment and put it into one data set:
This can be accomplished by calling the History API and asking for one piece of data at every time interval. We start at a given date in the past, in this example 24 hours. We then call pubnub.history with a count of 1 at the date. When we get data back, store it in a list and call it again with the start date plus our timestamp increment; in this case one hour. To load snapshots of one hour increments in JavaScript we’d do something like this:
The HistoryLoader is wrapped into an object that can be generalized for different use cases. It is utilized in this example like so:
Now that we have our dataset loaded, let’s build a visual graph on a standard Cartesian coordinate system using D3js as our rendering engine.
Building the Bitcoin D3js Graph
This part is going to assume you have some prior knowledge of D3js. Since D3js is a massive library that can apply to thousands of applications we will not go into too much detail about the inner workings of it. We recommend you read some of the D3js Wiki & Documentation before you move forward to familiarize yourself with how D3js works.


