Bitcoin trading charts
 With a volatile asset like bitcoin, charting software needs to provide maximum functionality for our traders to keep up with the market. Here are three reasons why our clients love charting with TradingView:
1. Compare multiple bitcoin exchanges quickly
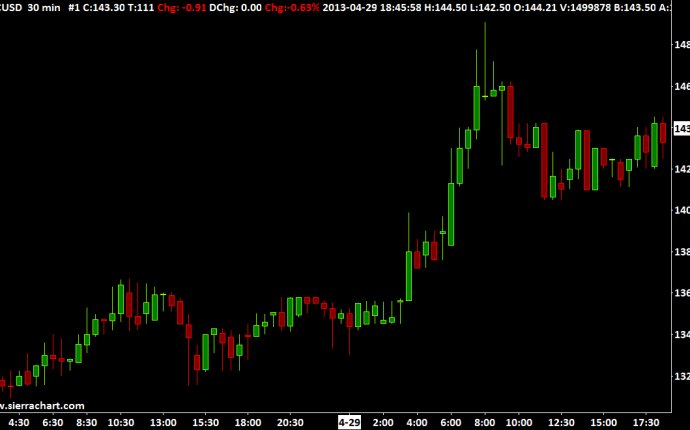
Compared to major commodities / currencies, pricing inefficiencies are more common in bitcoin. This is because of less liquidity and few institutions conducting high frequency trading. This opens up arbitrage opportunities to profit from pricing differences between exchanges.
To spot these opportunities, traders can overlay TradingView’s bitcoin charts and instantly trade on BTC.sx when a price inefficiency is found. In the above example, there is a slight delay in the bitcoin exchanges following each other. Specifically, at 8:30 Bitstamp (blue line) was slow to follow the sell-off on Bitfinex (candle sticks), creating an opportunity to short bitcoin at BTC.sx.
Without the speed and reliability offered by TradingView and BTC.sx, this minute-long window of opportunity can be easily missed.
 2. Advanced technical analysis features
Given that bitcoin is a highly speculative asset, a lot of price movements are based on greed and fear cycles and technical analysis. Other major currencies are issued by central banks that partly influence exchange rates when adjusting monetary policies. However, bitcoin has no central bank. Consequently, the price is driven entirely by supply and demand, making it critical that bitcoin traders identify technical analysis trends.
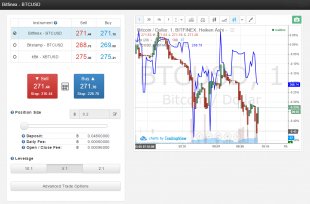
Thankfully, TradingView supports of 100 pre-built trading indicators that can be applied to a chart with a single click. For bitcoin traders, in particular, the advanced indicators are useful to reveal hidden trends.
In the above example, Ichimoku Clouds have been used to reveal a bullish trend with strong support. The first buy signal was revealed at 12:00 on 2nd of March 2015, with a bullish crossover when the Senkou Span A line crossed the span B line. The next buy signal was at 14:00 on 3rd of March when the price bounced off the cloud, demonstrating strong support and that the market had appetite to buy more bitcoins.
3. Compare bitcoin to other financial assets
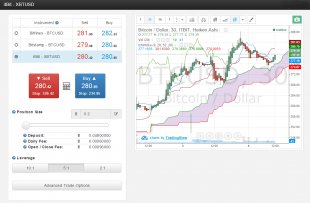
Some bitcoin enthusiasts have high expectations for digital currencies. This includes bitcoin replacing the US dollar. TradingView is the only technical analysis tool that allows any currency index to be plotted against bitcoin, allowing our traders to compare bitcoin against other non-paired currencies.
For instance, in the above chart the euro and the rubble has been overlaid on a bitcoin chart. No major correlations have been found, however if governments continue quantitative easing and fail to address budget deficits, significant capital flows may move away from these currencies to other assets, including bitcoin.
Even if this seems far-fetched, traders can still use this insight on the premise that other traders will be watching the performance of bitcoin against other currencies. A similar example of this is when – all because traders questioned the health of the Euro.
Summary
Since BTC.sx integrated TradingView our traders and our business has not looked back. The market-leading functionality for bitcoin technical analysis gives our traders the insight they need to make informed trading decisions.


