Bitcoin profitability chart
 Rod Garratt and Rosa Hayes
In a previous post, we discussed bitcoin miners’ incentives to undertake a 51 percent attack given the current condition of the bitcoin market. We also speculated that high profits and free entry would cause more miners to enter the market, driving marginal mining profits to zero in the long run. Since then, the price of a bitcoin has declined over 40 percent and both the hash rate and the difficulty level of the bitcoin mining problem, which adjusts automatically to changes in the hash rate, appear to have leveled off. Our most recent calculations suggest the long run may have arrived.
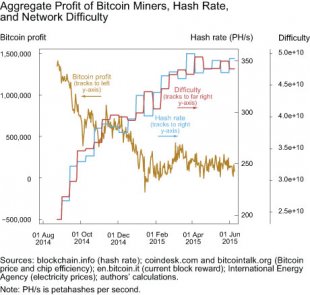
The following chart illustrates the path of aggregate bitcoin mining profit since September 2014, using current estimates of chip efficiency and updated electricity price data from the recently published 2014 report of the International Energy Agency. The gold line shows our estimate of the aggregate daily profit to bitcoin mining, measured in dollars. The red line shows the difficulty level of the bitcoin mining problem, measured in terms of the expected number of hashes needed to win a new allocation of bitcoins. The blue line shows total hash rate of the bitcoin community, measured in petahashes per second.

Our estimate of the aggregate daily profit of bitcoin miners dropped below zero for several days in mid-January 2015. The average hash rate over the two-week period following the realization of negative profit was noticeably lower than the average hash rate over the preceding two-week period. It appears that diminished profit may have prompted some miners to exit the market or to reduce their mining efforts. This lower average hash rate caused the network difficulty level to adjust downward at the next retarget, and the relative increase in the ease of mining attracted additional hashing power to the network.
There were also declines in the two-week average hash rate even before the network experienced negative aggregate profit in January. In particular, in both of the two-week difficulty periods beginning in mid-November 2014, the average hash rate was lower than in the previous two-week period. Our calculations suggest that aggregate mining profit at the time was above $800, 000 per day. In order to explain these earlier reductions in the hash rate we need to decompose our previous measure of aggregate profit into its individual components.
Breakeven Electricity Price
One important assumption underlying our calculations is that half of the bitcoin miners receive industrial energy pricing and half receive residential energy pricing. However, in evaluating miners’ entry and exit decisions, it may be more informative to consider miners’ breakeven price of electricity instead of assuming that all miners face the average market price. When a miner’s electricity price is higher than her breakeven price, we expect her to either exit the market or upgrade her mining technology.


